Launching Quantum0.1: A free medium-term forecast of German day-ahead market prices

While nowadays there is a myriad of open-source data on European energy markets, there is one area almost completely untackled and hidden behind expensive paywalls of professional analytics firms: short- to medium-term electricity price forecasts. We decided to change that by making the results of our internal price forecasting tool, Quantum0.1, freely available on this blog and newsletter. We aim to regularly publish a two-week forecast of quarter-hourly day-ahead prices on the German spot market. Subscribers to our newsletter (see below) get the forecast delivered to their inbox for free every Monday morning. In the following, we explain how our model works and what kind of input data we use. And, of course, we also benchmark it against state-of-the-art forecasting methods.
The Data
One central fact about today's electricity spot markets is that they are mainly influenced by weather [1]: prices are usually low when there is a surplus of renewables and high when production of wind and PV assets is scarce.
There can be, of course, also secondary and less direct effects of weather on electricity prices. For example, when temperatures are high, there is a good chance that there is a higher demand from air conditioning units (even more so in the future) [2]. Another example is that nuclear power plants (in the case of Germany, those in neighboring countries, respectively) are prone to curtailment during heat waves since using river cooling would dangerously elevate water temperatures.
In addition, there are temporal effects shaping price curves: when people get up in the morning or return from work in the evening, demand rises, which can drive up prices [3]. A second temporal pattern can be observed as a differentiation between weekdays and weekends, and holidays and non-holidays.
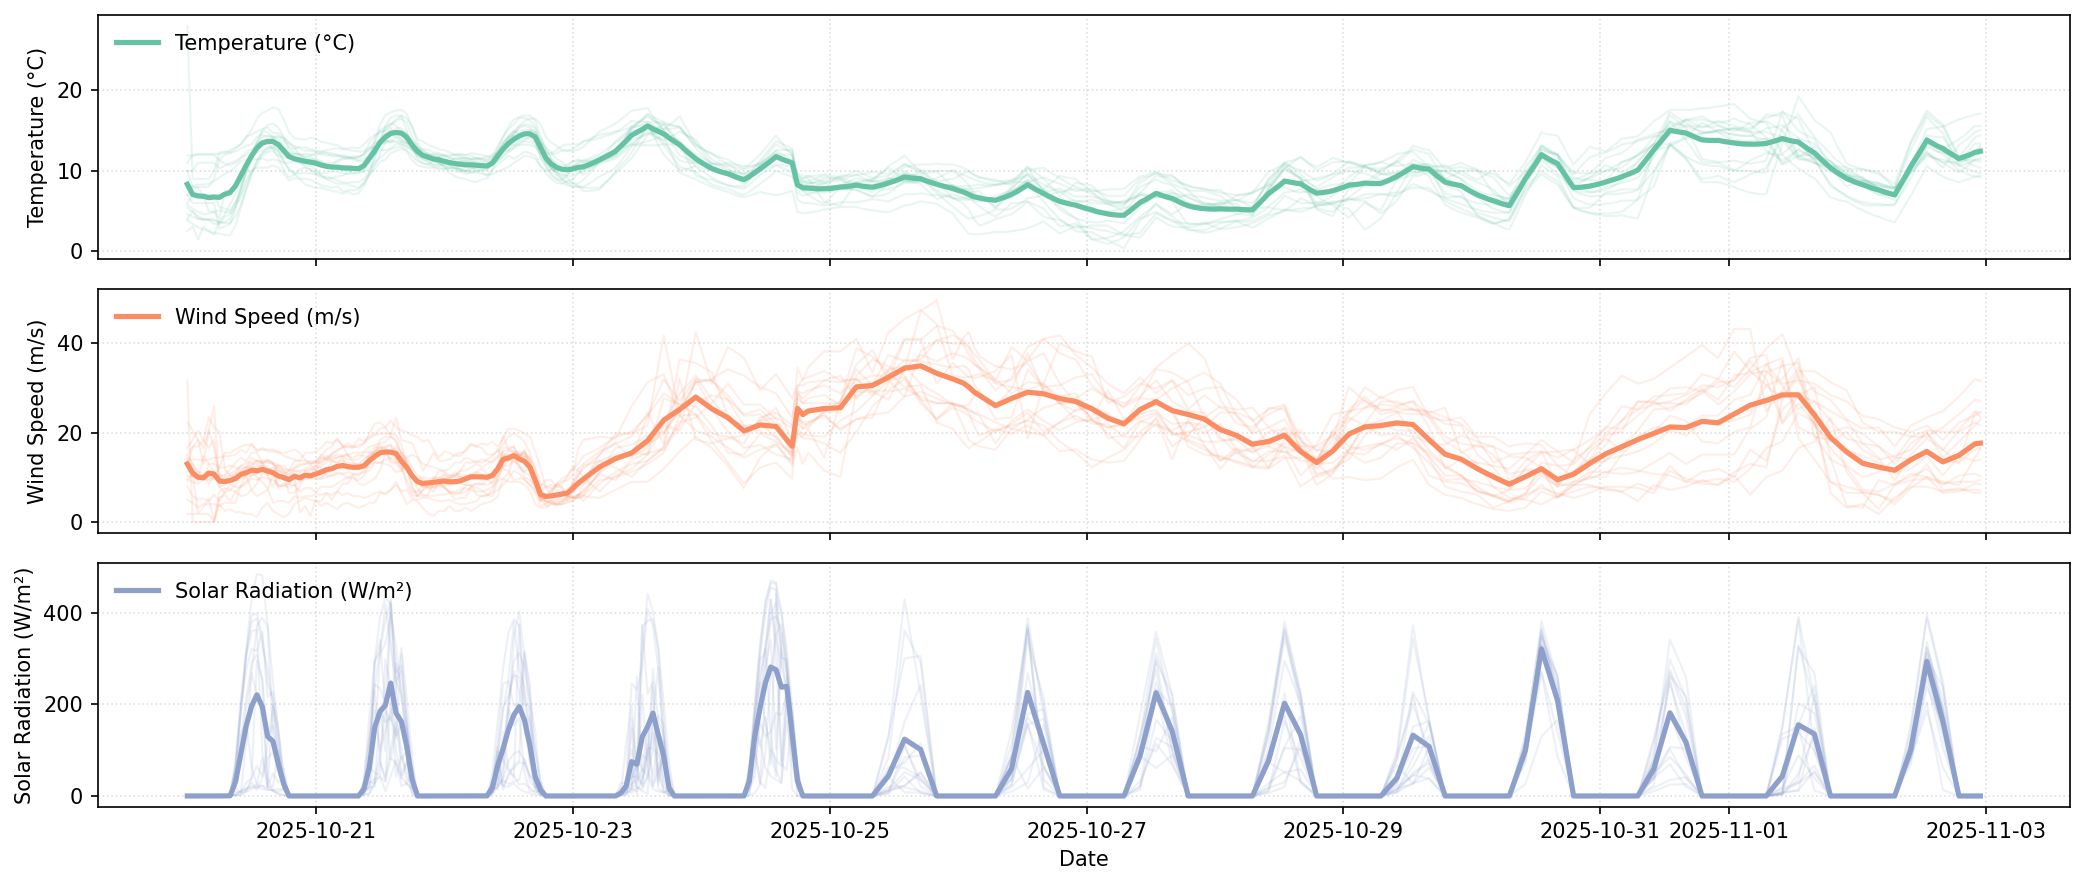
We use this knowledge to construct the input dataset for our Quantum0.1 model. We use high-quality weather data at 15 specific regions in Germany, which we compile from over 100 weather stations, including temperature, feels-like temperature, dew point, humidity, precipitation and precipitation cover, snow and snow depth, wind speed and wind gusts, atmospheric pressure, cloud cover and solar radiation and solar energy measurements [4]. For the same locations, we obtain 14-day forecasts of all input variables. In addition, we calculate sine and cosine encoded time-of-day and hour-of-day variables, which are usually more beneficial for forecasting models than one-hot-encodings or regular representations of hours [5].
Based on the curated dataset, we train our machine learning-based medium-term price forecasting model.
The Model
Without giving away too much of the secret sauce, we are using a top-notch machine learning model with tuned hyperparameters and a special feature that emphasizes recent market developments. By doing so, our model reacts quickly to the most recent price developments, such as those driven by new renewable assets entering the market, heat waves, and the BESS ramp-up.
The Benchmarking
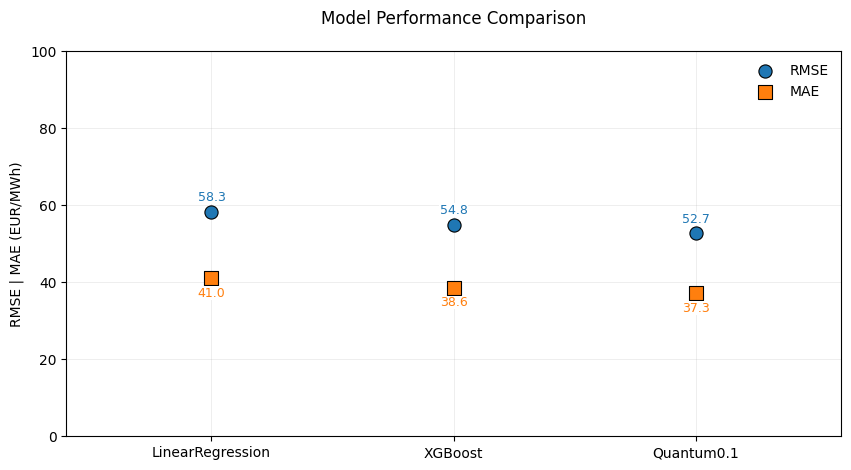
We benchmark our model against a standard linear regression and XGB Boost model. We evaluate in terms of the typical metrics RMSE and MAE [6]. The benchmarking is conducted based on 15 14-day-ahead forecasts, such as illustrated below with data from the 19th of September to the 2nd of October 2025.
You might ask: Why are you only considering so few days? The answer is: while we have worked on our model for quite a while, we just started systematically tracking large-scale weather forecasts since mid-September. However, we will continuously update this.
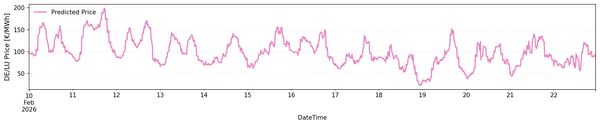
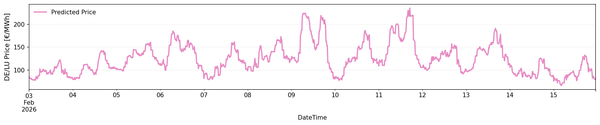
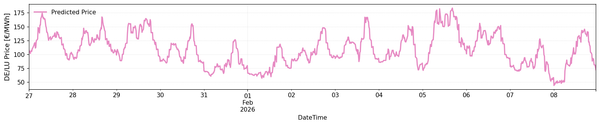
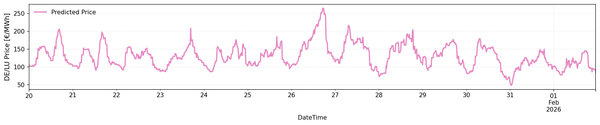
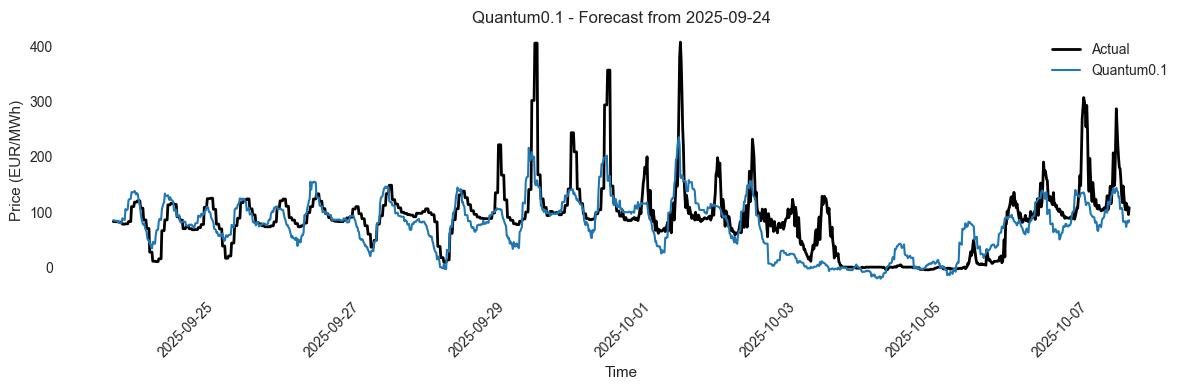
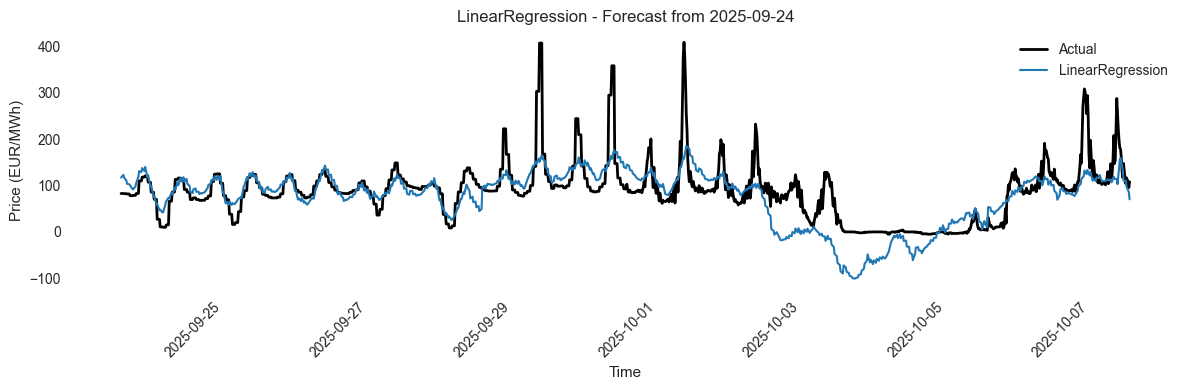
In the following, we show a 14-day forecast from our Quantum0.1 model, compared with a Linear Regression model, for the same period:

vs.:
First, we can observe that both models deliver a decent forecast of daily shapes, even with a two-week forecasting horizon. This speaks for our underlying dataset and the quality of our weather forecasts.
However, our Quantum0.1 model does a particularly good job in estimating the zero-price period at the end of the forecasting horizon (vs. negative forecasts of the Linear Regression). Second, it is able to capture the height of peak prices better and thereby spreads.
Accordingly, our model outperforms all benchmarked models (see below) in terms of RMSE and MAE . The MAE of 37.3 can be interpreted as: on average, our model has an error of 37.3€ when forecasting quarter-hourly day-ahead market prices on a two-week horizon. This might sound high, but it is primarily guided by recent price spikes in the 400€ region. We have also benchmarked the model in initial experiments against state-of-the-art Transformer models, which had significantly higher computational costs but worse results (even than the Linear Regression), so we resort here to well-performing tabular methods.
The Caveats and the Use Case
We position this forecast as a relatively simple open-source alternative to the costly models provided by other energy analytics firms. The model currently only has access to a limited number of weather stations, does not include information about neighboring markets, and does not consider the transmission network. However, the underlying machine learning model is proven and robust, and the forecasts beat all the applied benchmarks.
Besides, every price forecasting model is only as good as the underlying weather forecast. And especially for a two-week horizon, you can ask yourself: how reliable is the outlook for the weather on Monday in two weeks? Correspondingly, the error of our model grows over time, and the predictions have to be always taken with caution.
However, we are convinced that we can provide something useful to European energy markets and the community. Our model usually does a good job in indicating price trends and upcoming developments on the market. That's where we see the use case of our model: getting an outlook on upcoming price developments, in addition to (LLM-generated) interpretations and explanations. Besides for everyone on the trading floors, this can also be helpful for industrial companies that are subject to spot market prices (and hence can pre-plan their production schedules).
The first forecast on the 20th October, 2025
Every Monday morning from now on, we will post a forecast of the upcoming two weeks' quarter-hourly day-ahead prices on the DE/LU market. We will continuously update and upgrade our model and publish the results in this Google-Sheets. We will publish the forecast alongside an LLM-generated interpretation of the forecast, considering the weather forecast, spread levels and forecasted price regimes:
Update (27.10.2025): We have already published this article last week - the new price forecast for the next two weeks can be found here.
⚡ 14-Day Price Forecast: DE/LU Oct 20-Nov 2: Wind Pattern Creates €189 Daily Swings
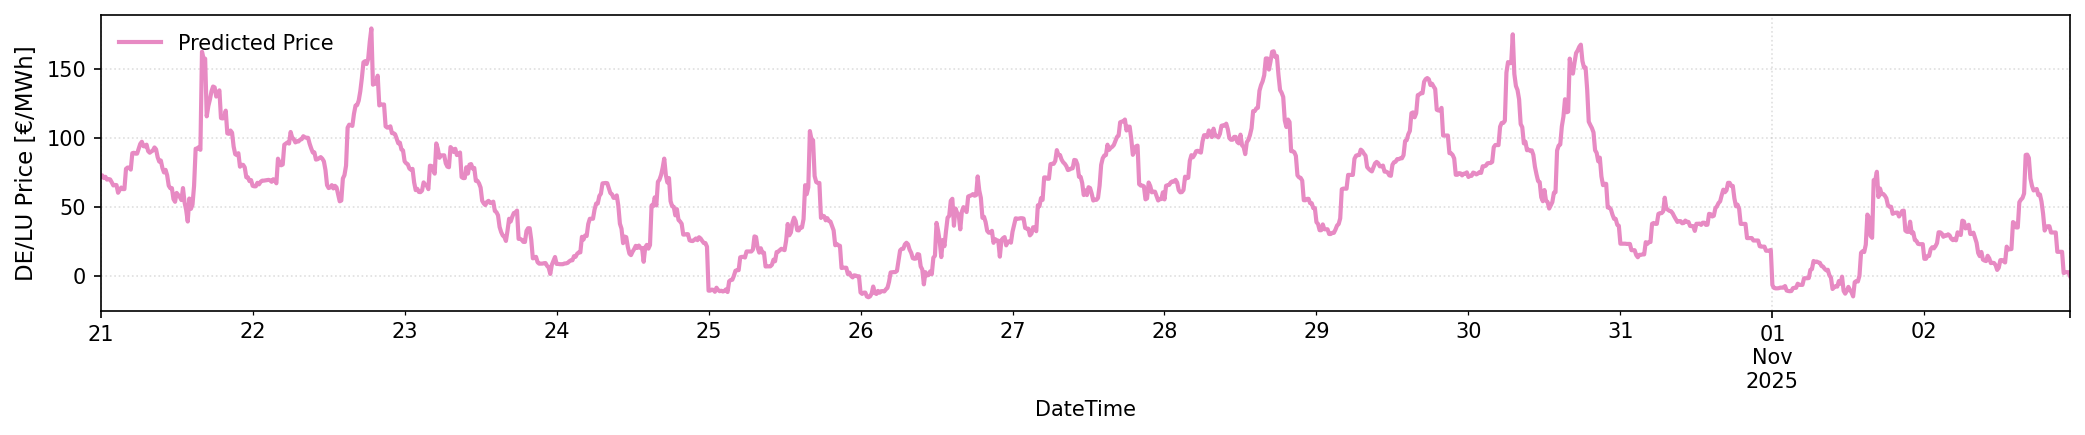
- 🌊 Consistent daily structure with wind-driven volatility: Prices stabilize at €31–42 during overnight hours, gradually rise to €43–52 during midday solar peaks, then sharply climb to €86–91 in afternoon hours before receding by evening. This pattern repeats consistently across calmer days but breaks dramatically during wind-dominated periods from October 23–26 and October 29–November 1.
- 💨 Extreme wind episodes suppress prices to negative levels: During periods of 24–32 m/s sustained winds (October 23–26 and October 29–November 1), prices fall to negative levels, reaching €-14.76 on October 25 and €-12.00 on October 26, driven by abundant wind generation exceeding demand. Wind speeds peak above 20 m/s on at least seven days, consistently pushing overnight and early morning hours into negative territory.
- 📈 October 30 produces highest price spike at €175.16 at 06:00 hours: Price volatility widens dramatically during this period, with October 30 showing morning prices up to €175.16, followed by sustained afternoon peaks of €147–162. October 21, 22, and 28 also register afternoon spikes reaching €153–162 at 14:00–17:00 hours, indicating reduced wind supply during early autumn transition.
- ⏰ Afternoon hours command consistent premium prices of €86–91: Price analysis across all days shows 14:00–17:00 consistently averages €86–91, making this the highest-value trading period except during wind storms and October 30's anomaly. Conversely, 10:00–13:00 midday represents the lowest-cost period across the forecast at €43–52 per megawatt-hour.
- 📊 Total price range spans €189.92 from negative to peak, with October stable but later days volatile: October 20 shows minimal volatility at €69–71, reflecting low wind and consistent solar. October 24–26 exhibits extreme volatility encompassing negative prices, October 28 reaches €162.54, and October 30 sets the forecast high of €175.16, demonstrating a transition from stable to highly volatile market conditions over the 14-day period.
Sources
[1] Mosquera-López, S., Uribe, J. M., & Joaqui-Barandica, O. (2024). Weather conditions, climate change, and the price of electricity. Energy Economics, 137, 107789.
[2] Staffell, I., Pfenninger, S., & Johnson, N. (2023). A global model of hourly space heating and cooling demand at multiple spatial scales. Nature Energy, 8(12), 1328-1344.
[3] Khoshrou, A., Dorsman, A. B., & Pauwels, E. J. (2019). The evolution of electricity price on the German day-ahead market before and after the energy switch. Renewable Energy, 134, 1-13.
[4] Sgarlato, R., & Ziel, F. (2022). The role of weather predictions in electricity price forecasting beyond the day-ahead horizon. IEEE transactions on power systems, 38(3), 2500-2511.
[5] Semmelmann, L., Hertel, M., Kircher, K. J., Mikut, R., Hagenmeyer, V., & Weinhardt, C. (2024). The impact of heat pumps on day-ahead energy community load forecasting. Applied Energy, 368(C).
[6] vom Scheidt, F., Medinová, H., Ludwig, N., Richter, B., Staudt, P., & Weinhardt, C. (2020). Data analytics in the electricity sector–A quantitative and qualitative literature review. Energy and AI, 1, 100009.